Analysis
Sentiment stability of AI plot interpretations across repeated trials.
What we did
The example plot image (example.jpg) was submitted to each model 30 times using the prompt "Interpret this plot." at default temperature. Each response was scored with VADER — a rule-based sentiment analyser returning a compound score from −1 to +1.
Differences between models were tested with a Kruskal–Wallis test, followed by pairwise Mann–Whitney U tests with Bonferroni correction. Effect sizes are reported as rank-biserial correlation r. Analysis run: 15 March 2026.
Mean sentiment ± 95% CI
Error bars = 95% CI (n = 30 per model)
Top 20 words by model
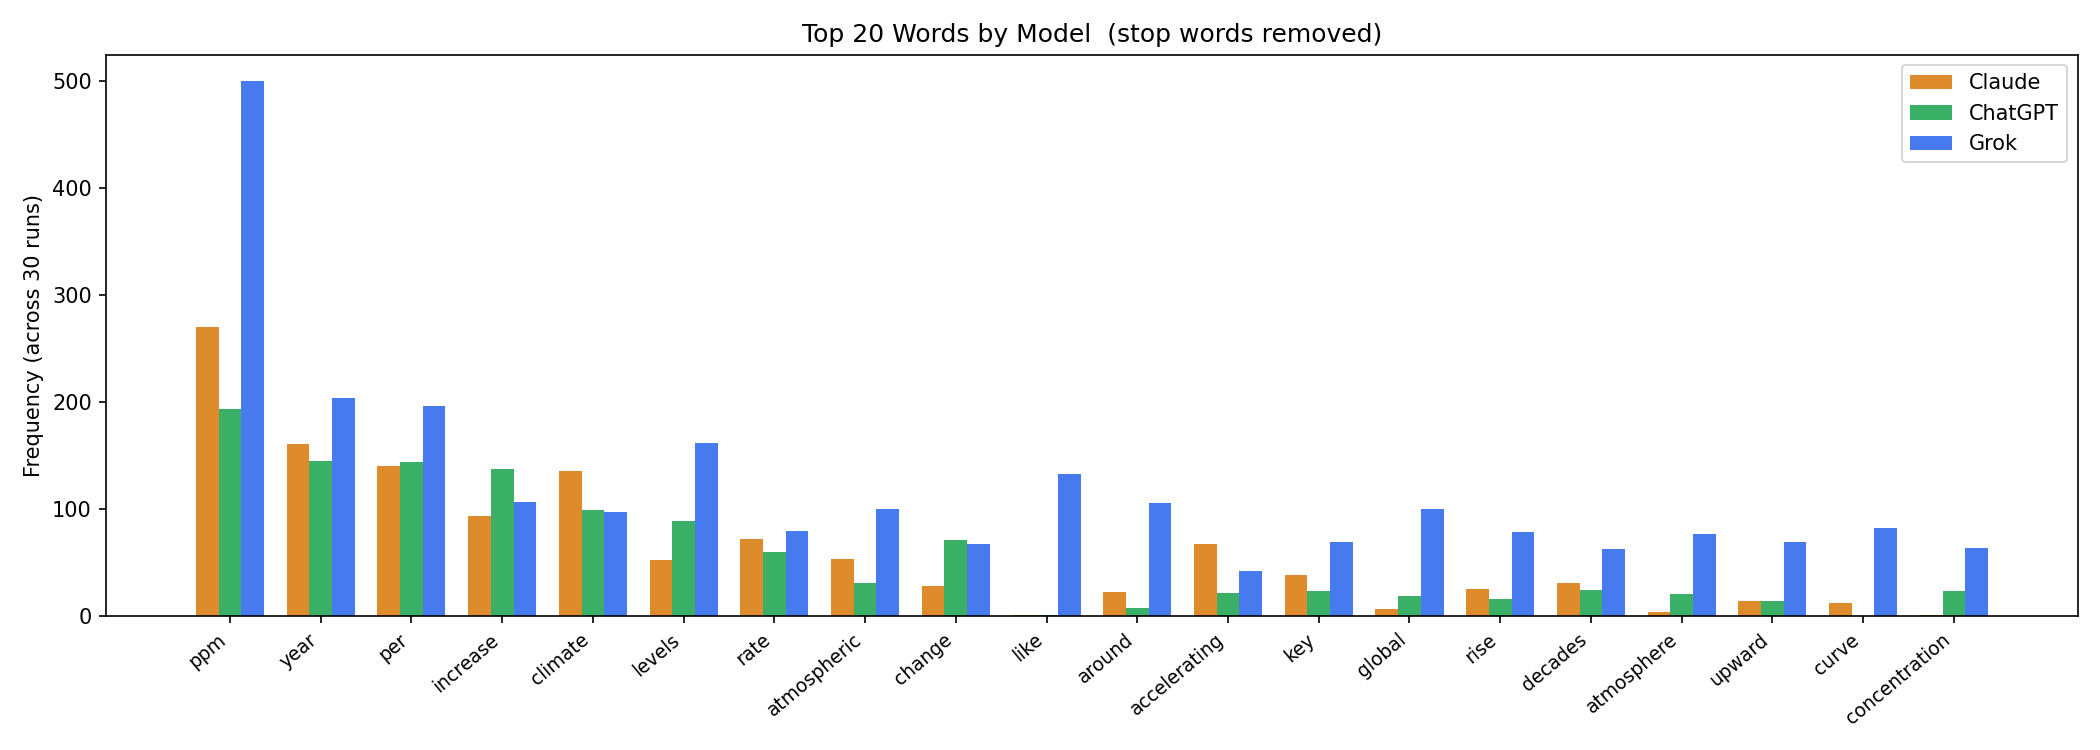
Stop words removed.
Descriptive statistics
| Model | Mean | SD | 95% CI | Median | Min | Max |
|---|---|---|---|---|---|---|
| Claude | +0.3691 | 0.4743 | [+0.199, +0.539] | +0.5384 | -0.6652 | +0.9274 |
| ChatGPT | +0.9231 | 0.0466 | [+0.906, +0.940] | +0.9327 | +0.7783 | +0.9723 |
| Grok | +0.9853 | 0.0104 | [+0.982, +0.989] | +0.9897 | +0.9607 | +0.9957 |
Significance tests
Kruskal–Wallis: H = 75.806, p <0.001 ***
| Comparison | p (Bonferroni) | Effect r | |
|---|---|---|---|
| Claude vs ChatGPT | <0.001 | +0.934 | *** |
| Claude vs Grok | <0.001 | +1.000 | *** |
| ChatGPT vs Grok | <0.001 | +0.980 | *** |
*** p < 0.001 | r: |0.1| small |0.3| medium |0.5| large
Shared vocabulary (top 20 words)
Re-run python analysis/run_analysis.py to populate word overlap data.
Raw scores
| Run | Claude | ChatGPT | Grok |
|---|---|---|---|
| 1 | +0.5083 | +0.9153 | +0.9792 |
| 2 | -0.1474 | +0.9517 | +0.9883 |
| 3 | +0.1027 | +0.8271 | +0.9895 |
| 4 | +0.8047 | +0.9524 | +0.9927 |
| 5 | +0.6582 | +0.9545 | +0.9940 |
| 6 | +0.8591 | +0.9552 | +0.9955 |
| 7 | -0.6652 | +0.9392 | +0.9678 |
| 8 | +0.2023 | +0.9501 | +0.9607 |
| 9 | +0.7717 | +0.9432 | +0.9711 |
| 10 | -0.3213 | +0.9020 | +0.9903 |
| 11 | +0.8126 | +0.9552 | +0.9909 |
| 12 | +0.6382 | +0.9565 | +0.9919 |
| 13 | +0.8151 | +0.9628 | +0.9929 |
| 14 | +0.8591 | +0.9371 | +0.9728 |
| 15 | -0.0240 | +0.9723 | +0.9944 |
| 16 | -0.1761 | +0.9247 | +0.9759 |
| 17 | -0.1406 | +0.8910 | +0.9929 |
| 18 | +0.6705 | +0.8020 | +0.9854 |
| 19 | +0.5927 | +0.9217 | +0.9918 |
| 20 | +0.5574 | +0.9217 | +0.9898 |
| 21 | +0.5194 | +0.9623 | +0.9836 |
| 22 | -0.1655 | +0.9169 | +0.9939 |
| 23 | +0.7902 | +0.9182 | +0.9948 |
| 24 | +0.2658 | +0.9273 | +0.9875 |
| 25 | +0.7579 | +0.7783 | +0.9933 |
| 26 | -0.1027 | +0.8885 | +0.9957 |
| 27 | -0.5719 | +0.9284 | +0.9643 |
| 28 | +0.4035 | +0.9666 | +0.9763 |
| 29 | +0.8720 | +0.9274 | +0.9709 |
| 30 | +0.9274 | +0.9423 | +0.9896 |